Scope
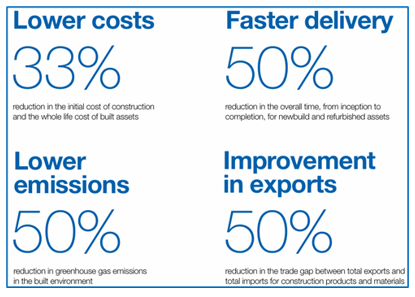
The Metrics and Demonstrators working group is a cross-industry collaboration that aims to enable the construction sector, both clients and the supply chain, to use data to understand and demonstrate performance, and deliver better outcomes for clients, funders, end users and those working in construction. It was founded in 2016 in the context of Construction 2025, which was published in 2013 as a joint industry and Government strategy that aimed to place Britain at the forefront of global construction. Construction 2025 contained four very ambitious targets, which can be seen below. The Metrics and Demonstrators Group was established to understand measurement and progress.

Mission
We work with industry, clients and Government to develop an industry that has the capacity, capability and resilience to:
- Respond to economic challenges;
- Drive growth and promote investment;
- Improve productivity through digital adoption, industrialisation and innovation; and
- Create improved societal outcomes.
Our mission includes promoting the good work that the construction industry is delivering, and show how it is responding to pressures and expectations – including the transition to Net Zero.
We believe that clients and the construction sector can only benefit from working more closely together, and this also entails clients challenging contractors and the supply chain to deliver better projects and rewarding them for success, thereby establishing a commercial incentive for the construction sector to transform. Many of the barriers to better projects and a better sector are quite deeply embedded, as described in the Farmer Review, Modernise or Die (2016). But as Ann Bentley, author of Procuring for Value, has said “In my view, the simplest way that outstanding projects will be delivered is if clients demand outstanding projects, and to do this they need to know what an outstanding project is and how to demand it!” Our activities, which can be seen below, are about enabling a coalition of the willing to ask for better and show they can deliver better.
Current Activities
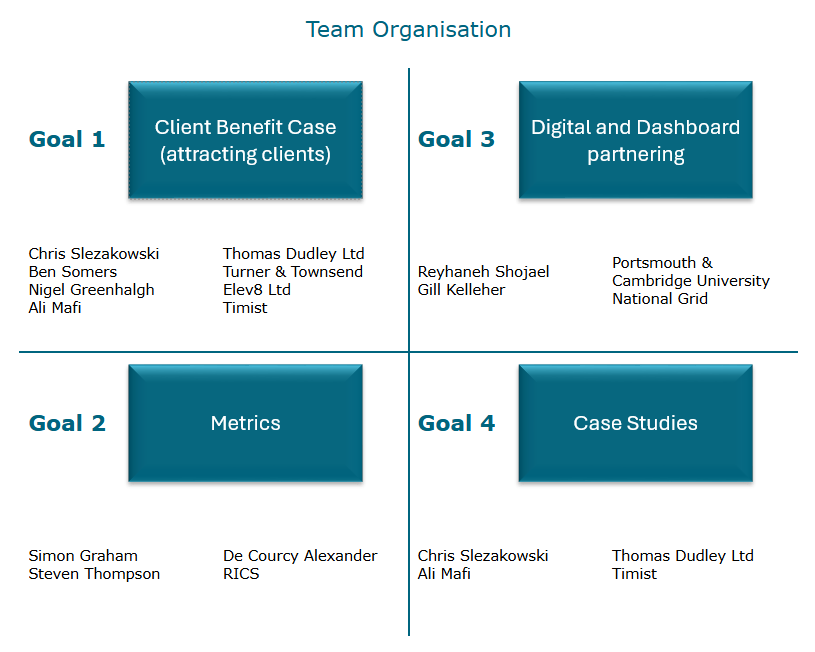
We meet every six weeks as group to progress our mission. At a practical level, our work is divided into four streams:

Client Benefit Case
This team lead our work on articulating the benefits of a ‘smart construction’ approach, namely one based on whole life cost, industrialisation and taking full advantage of the opportunities created by digital technologies. We talk to clients, the construction supply chain, Government and representative bodies to build the business case to engage with us and support the transformation of the construction sector.
Metrics
This team ensure that we maintain a comprehensive and relevant set of measures that enable clients and the supply chain to understand and contextualise performance. We collate performance information for our set of metrics, which is are then published as the Smart Construction Dashboard every December We also produce an annual report to accompany the publication that talks through what is happening with performance and the implications. This annual report is also used to ensure that metrics are consistent and transparent by explaining the information that is required and where it is sourced from.
Digital and Dashboard Partnering
The Working Group’s main product is the Smart Construction Dashboard (SCD). The role of this team is to develop the SCD as a digital product, meaning that user participation is much easier because users can interact via a portal. It will also mean that we can use workflows to process data and produce project-based SCDs for clients and contractors. Our current focus is our work with Portsmouth and Cambridge Universities to produce a ‘minimum viable product’ digital version that can be used as a proof of concept to unlock funding for development.
Case studies
This team gathers information from SCD users to publish material that demonstrates the use of data to enable better understanding of performance and its translation into practice and improvement.
Useful resources
Benefit case – Benefits Case Slidedeck
Metrics
- The Smart Construction Dashboard explained (Below)
- Smart Construction Dashboard, 2022 data 18 Nov 24 (published March 2025)
- Smart Construction Dashboard, December 2023 publication – Summary
- Smart Construction Dashboard, 2021 data (published December 2023)
- Smart Construction Dashboard, December 2023 publication – Metrics Report for 2021 data
Case studies
The Smart Construction Dashboard (SCD) explained
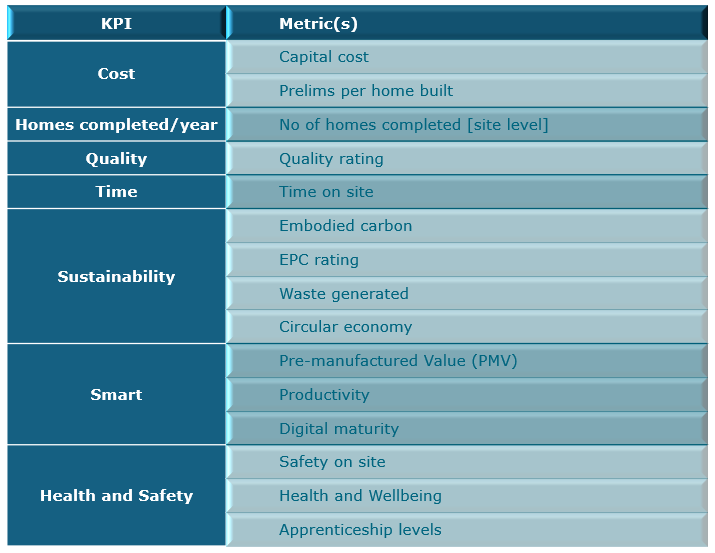
This consists of 7 KPIs and 15 Metrics, as seen below::

The SCD works at project level, ie an SCD will be created for a particular development. As can be seen above, many of the metrics are familiar as typical construction metrics in order to understand cost, programme and safety. The SCD complements these with a number of metrics that are intended to support clients and contractors in understanding how additional factors, eg productivity, embodied carbon, can also impact on site performance.
This data is contextualised via;
Targets These are given for 2025, representing the progress that the construction sector should have made. This means that SCD users can see where, ideally, their performance should be aiming for; and
Benchmarks These are more representative of wider, actual performance in the sector, and give users an opportunity to understand how their performance compares against peers.

